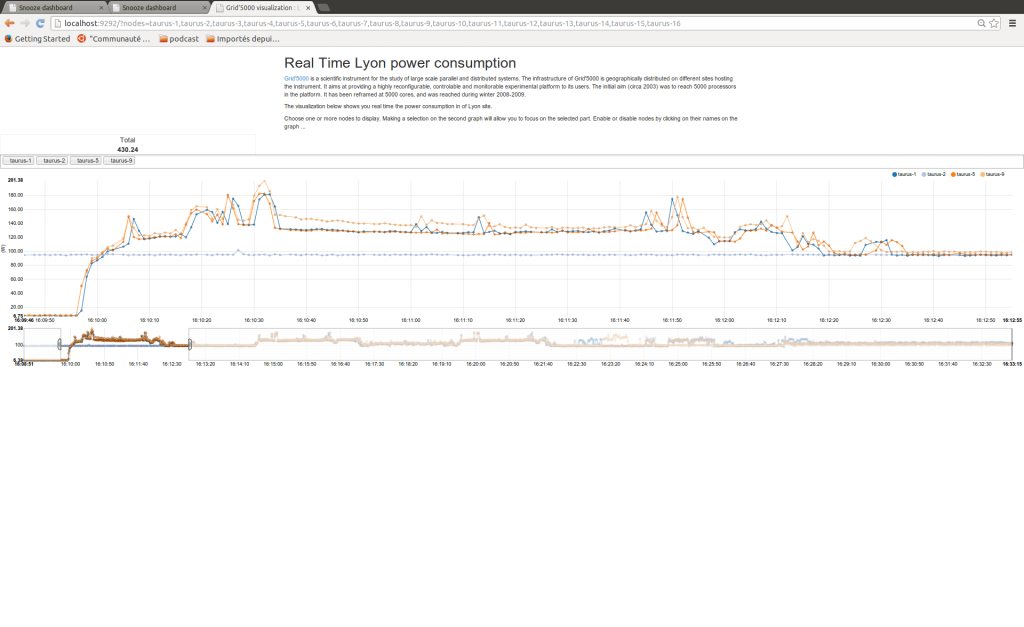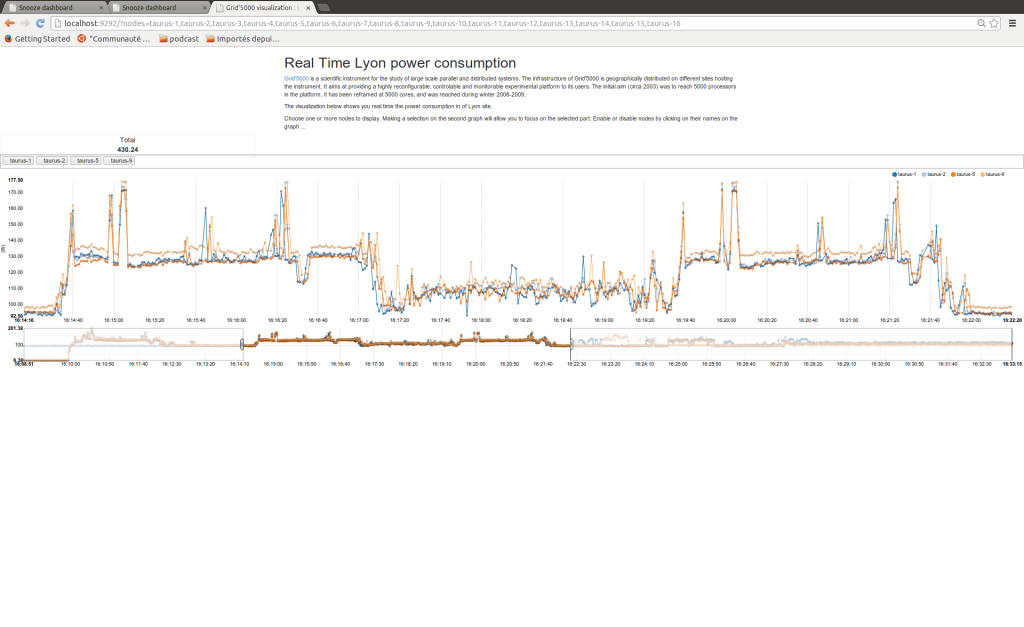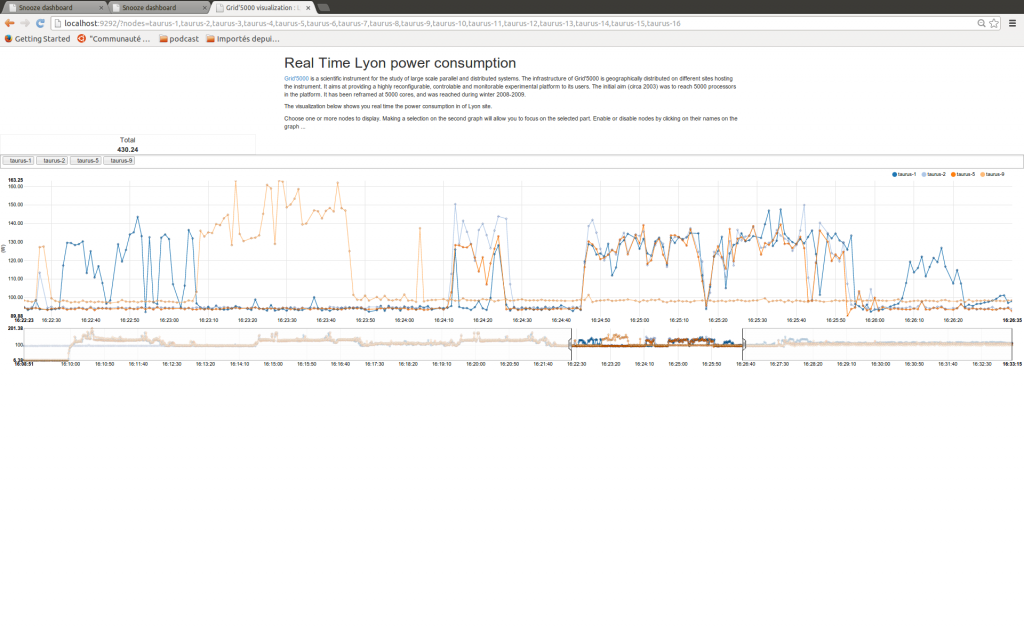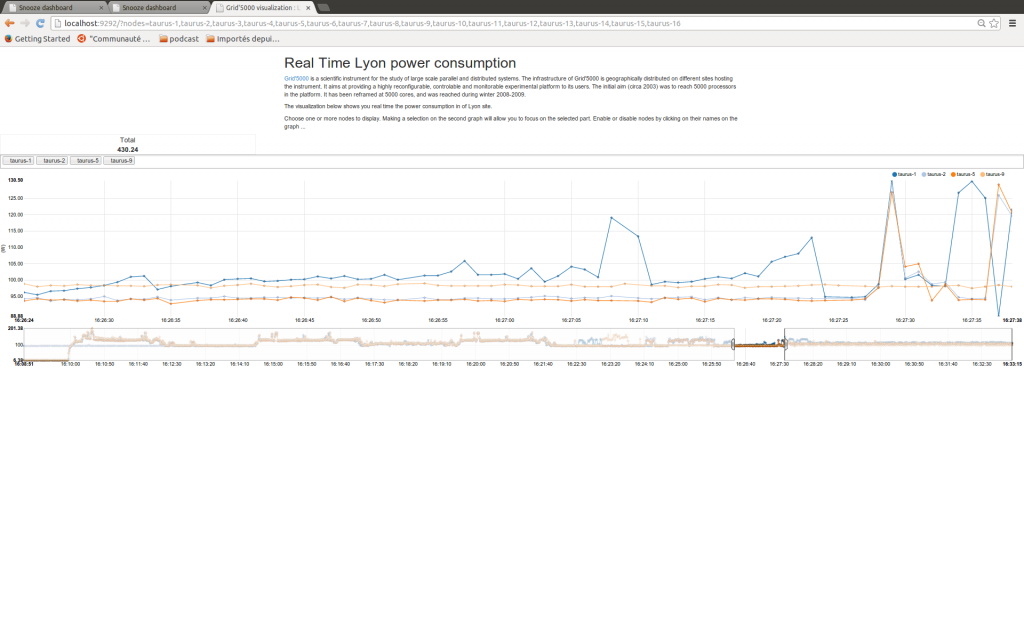

I was playing lately with power meters installed in the Lyon site.
I’ve built a small web application to show real time the power consumption of the nodes.
System set up
I deployed Snooze on taurus cluster. 2 of the 16 machines were out of order, thus I deployed Snooze on the 14 remaining machines with the following set up :
- 1 node : bootstrap
- 3 nodes : group manager
- 8 nodes : local controller
- 2 nodes : cassandra
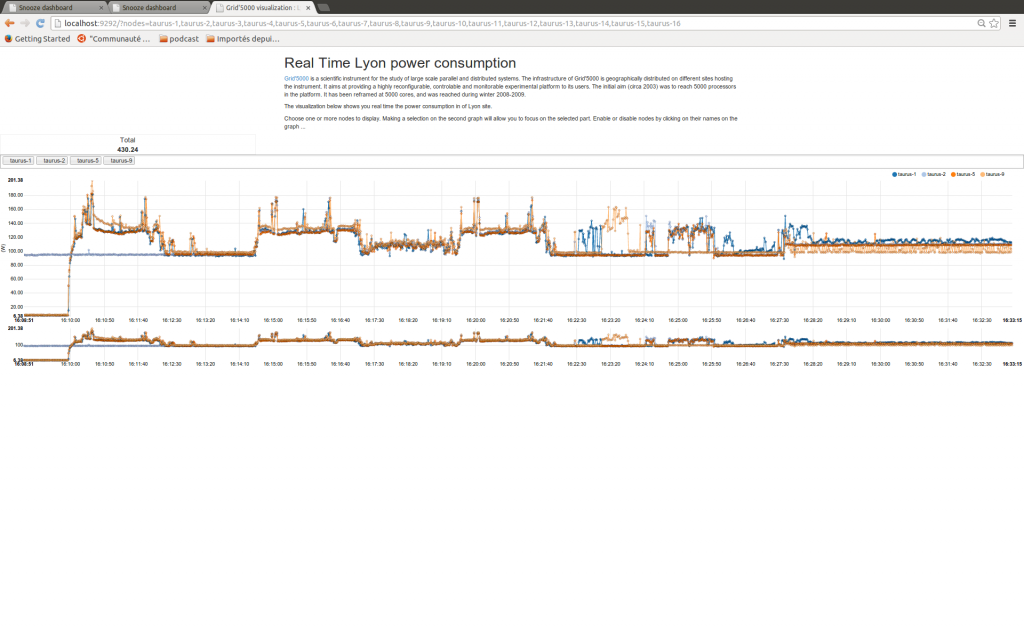
All the figures below depict the power consumption of the nodes during the deployment of Snooze. Only one node of each type is represented.
Let’s go through the different phases…
1Respawning phase
At the time of the reservation, some of the nodes used in the deployment were shutdown. The first phase is thus the respawning phase which will insure that all the 14 nodes are up and running before the deployment phase. This phase took approximately 4 minutes.
2Deployment phase
Once all the nodes are up, a debian/wheezy is deployed on the 14 nodes. This phase took approximately 6 minutes.
3Puppet phase
Once the wheezy environment is deployed on all the nodes we configure them using different puppet recipes.
- First Rabbitmq is installed on the bootstrap ( taurus-1)
- Then cassandra is installed (here on taurus-9)
- Snooze is installed on all the nodes (except taurus-9)
- Finally NFS is configured
These steps are sequential, maybe we could parallelized them.
4Post-install phase
In this phase we prepare the cluster by uploading base images into the image repository, configuring the network on compute hosts…
5Cluster start phase
And … Finally we start the cluster.
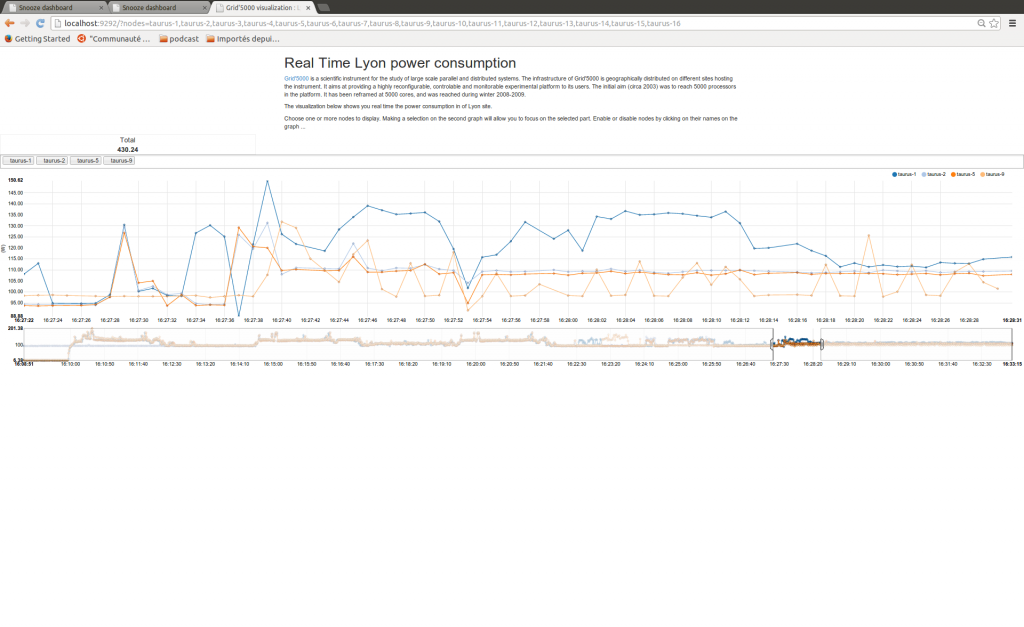
After that phase, we observed that without any load, the power consumption was about 1700 W in total (14 nodes).

